Candlestick chart

Candlestick chart
Type of financial chart.
No account needed. By playing, you confirm you're 13 or older and agree to the Terms of use.
No owners yet
Category: Empty
- 0 owners
- 0 copies
- 0 pulls
- Wishlisted
- 0
- In 0 albums
- On 0 showcases
- Market listings
- 0
Not sold on the market yet.
Readers' pathsAug 2026 – Oct 2026
Readers go next to
Share of the 2,090 clicks on its links

Fibonacci retracement
Technical analysis method (Finance).
7.9%

Box plot
Data visualization.
6.9%

Order book
Financial tool for tracking orders by buyers and sellers.
4.3%

Candle wick
String in a candle that holds the flame.
3.4%
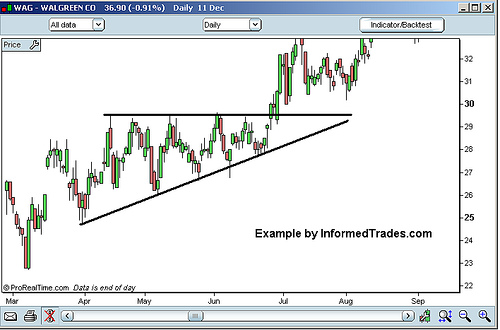
Chart pattern
Pattern within a chart when prices are graphed.
2.8%

Candle
Wick embedded in solid flammable substance.
2.3%

Market sentiment
General attitude of investors to market price development.
1.9%
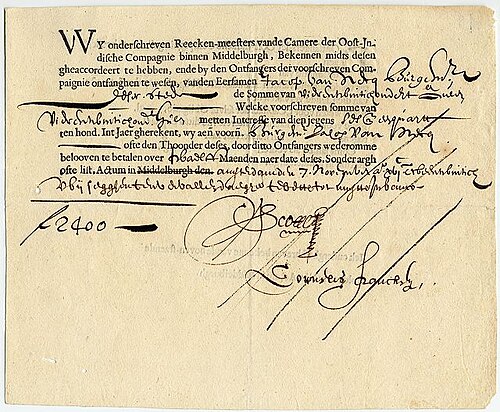
Security (finance)
Tradable financial asset.
1.5%

Morning star (candlestick pattern)
Pattern seen in stock market chart.
0.96%

Currency
Standardization of money.
0.62%
Readers come from
Share of the 1,500 readers arriving from another article