No account needed. By playing, you confirm you're 13 or older and agree to the Terms of use.
No owners yet
Category: Empty
- 0 owners
- 0 copies
- 0 pulls
- Wishlisted
- 0
- In 0 albums
- On 0 showcases
- Market listings
- 0
Not sold on the market yet.
Readers' pathsAug 2026 – Oct 2026
Readers go next to
Share of the 2,021 clicks on its links

Snellen chart
Eye chart.
35%

Landolt C
Optotype.
14%

LogMAR chart
Eye chart.
12%

Lea test
Eye chart designed for children.
11%
Visual acuity
Clarity of vision.
10%

Golovin–Sivtsev table
Standardized table for testing visual acuity.
5.8%

E chart
Ophthalmological chart.
4.5%

Monoyer chart
Medical diagnostic method.
2.7%

Glasses
Form of vision aid.
0.49%
Readers come from
Share of the 1,415 readers arriving from another article
Snellen chart
Eye chart.
55%
Visual acuity
Clarity of vision.
12%

Near visual acuity
Clarity of near objects or letters.
6.3%
Landolt C
Optotype.
4.4%
E chart
Ophthalmological chart.
2.9%

Tibetan eye chart
Diagram that allegedly is used to correct visual problems.
1.5%
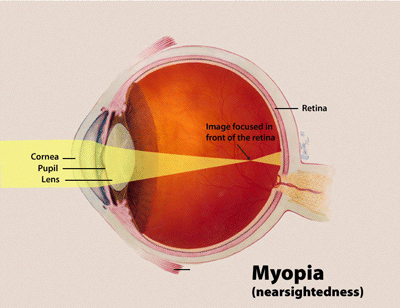
Myopia
Inability to focus on distant objects.
1.1%

Herman Snellen
Dutch ophthalmologist (1834–1908).
0.85%
Lea test
Eye chart designed for children.
0.85%

Jack Vance
American writer (1916–2013).
0.78%